library(tidyverse)
library(ggtext)
library(here)
#' https://ourworldindata.org/working-hours
df <- read_csv(here(
  "docs/blog/posts/ggplot2",
  "annual-working-hours-per-worker.csv"
))
df <- rename(df, Hours = 4)


highlight_countries <- c(
  "Vietnam",
  "Norway",
  "Germany",
  "China",
  "Bangladesh",
  "Ireland",
  "South Korea",
  "Singapore",
  "Myanmar",
  "Greece"
)

df %>%
  filter(Year == 1970 | Year == max(Year)) %>%
  group_by(Entity) %>%
  filter(n() == 2) %>%
  mutate(
    max_value_year = which.max(Hours),
    trend = ifelse(max_value_year == 1, "decrease", "increase")
  ) %>%
  ungroup() %>%
  mutate(
    highlight = case_when(
      !(Entity %in% highlight_countries) ~ "other",
      Entity %in% c("Myanmar", "Singapore") ~ "same",
      TRUE ~ trend
    )
  ) %>%
  ggplot(aes(factor(Year), Hours, group = Entity, color = highlight)) +
  geom_line(aes(size = ifelse(highlight == "other", 0.1, 0.7))) +
  # use 2 geoms to make sure highlighted countries' dots are placed on top
  geom_point(data = . %>% filter(highlight == "other"), size = 0.2) +
  geom_point(data = . %>% filter(highlight != "other")) +
  ggrepel::geom_text_repel(
    data = . %>% filter(highlight != "other"),
    aes(
      x = ifelse(Year == min(Year), 1 - 0.35, 2 + 0.35),
      label = glue::glue("{Entity} ({scales::number(Hours, accuracy = 1)})"),
      hjust = ifelse(Year == min(Year), 1, 0)
    ),
    size = 2.5,
    nudge_x = 0,
    direction = "y",
    family = "Fira Sans",
    segment.size = 0
  ) +
  scale_x_discrete(position = "top") +
  scale_size_identity() +
  coord_cartesian(clip = "off") +
  scale_color_manual(
    values = c(
      "other" = "grey60",
      "decrease" = "#092044",
      "increase" = "#C33C2E",
      "same" = colorspace::darken("#F0C94C", 0.2)
    )
  ) +
  guides(col = "none") +
  labs(
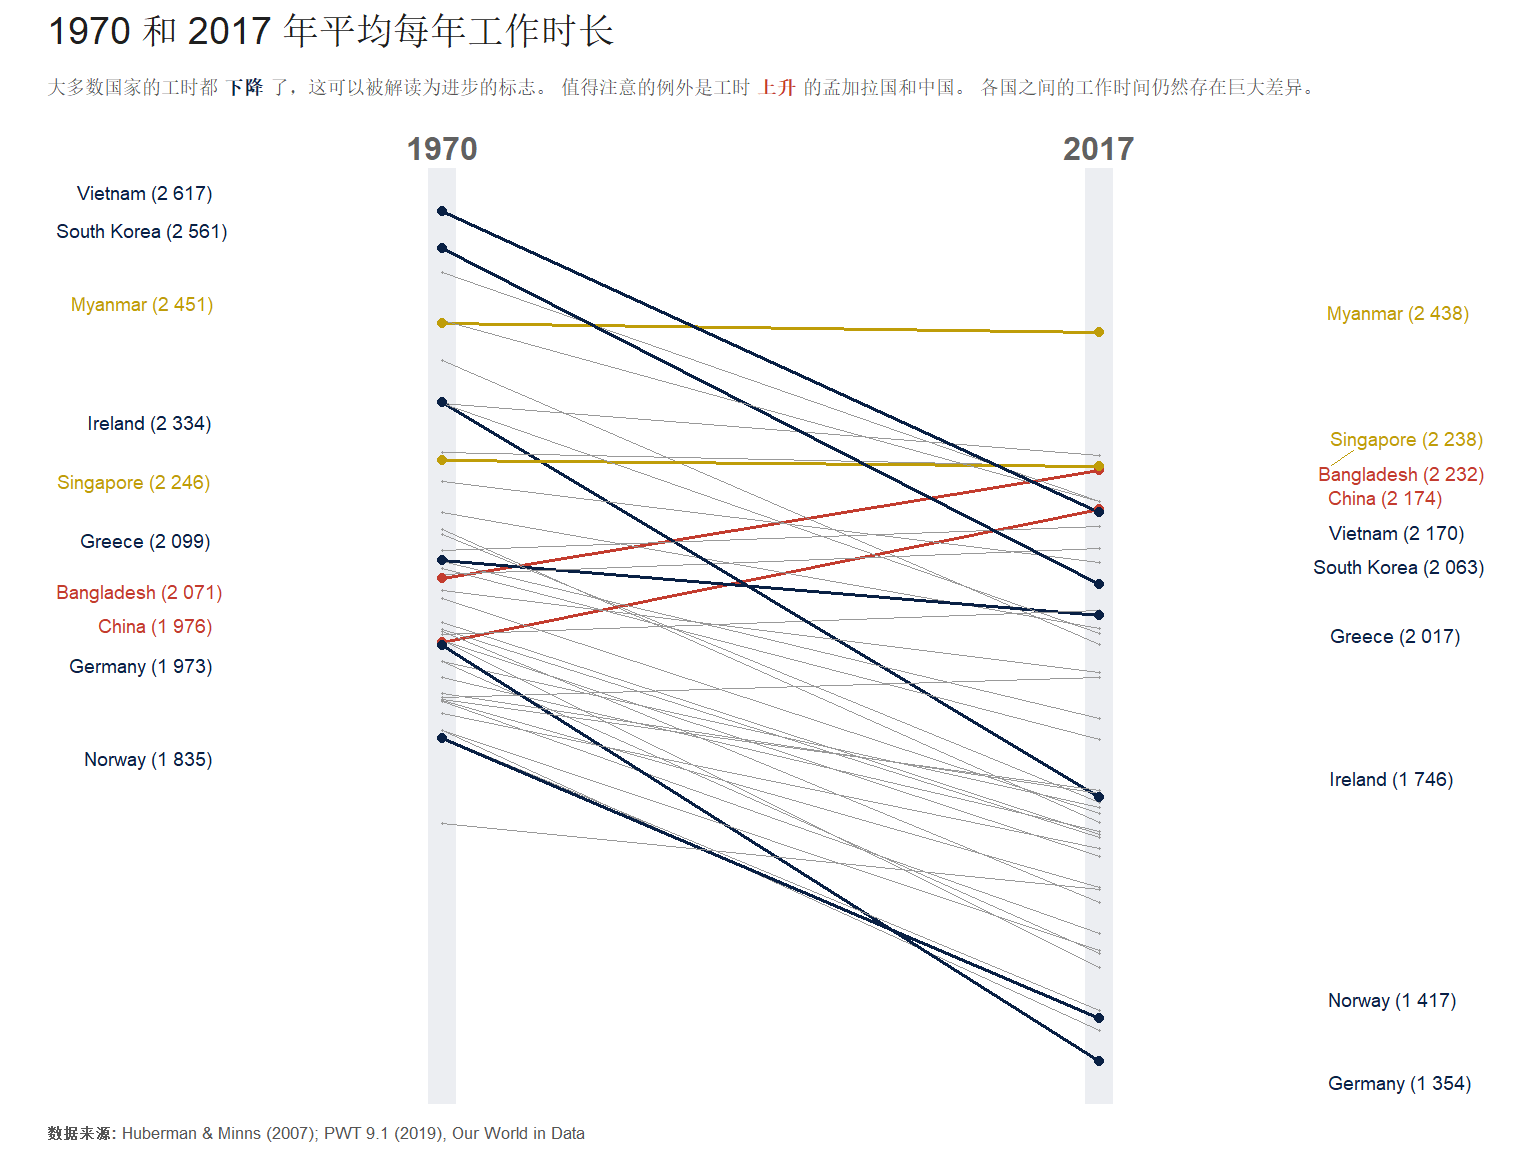
    title = "1970 和 2017 年平均每年工作时长",
    subtitle = "大多数国家的工时都 <b style='color:#092044'>下降</b> 了,这可以被解读为进步的标志。
      值得注意的例外是工时 <b style='color:#C33C2E'>上升</b> 的孟加拉国和中国。
      各国之间的工作时间仍然存在巨大差异。",
    caption = "**数据来源:** Huberman & Minns (2007); PWT 9.1 (2019), Our World in Data "
  ) +
  theme_minimal(base_family = "Fira Sans", base_size = 8) +
  theme(
    plot.background = element_rect(color = NA, fill = "white"),
    panel.grid = element_blank(),
    panel.grid.major.x = element_line(color = "#ECEEF2", size = 5),
    text = element_text(color = "#555555"),
    axis.title = element_blank(),
    axis.text.x = element_text(size = 12, face = "bold", color = "grey38"),
    axis.text.y = element_blank(),
    plot.margin = margin(t = 6, l = 16, r = 16, b = 4),
    plot.title = element_text(
      family = "Playfair Display",
      size = 14,
      color = "grey12"
    ),
    plot.subtitle = element_textbox_simple(
      margin = margin(t = 6, b = 12)
    ),
    plot.caption = element_markdown(
      hjust = 0,
      margin = margin(t = 8)
    )
  )


